You might already use Excel every day for numbers, lists, and simple charts. But have you ever wondered if Excel can do more—like a true business intelligence (BI) tool?
Can it help you uncover hidden trends, make smarter decisions, or visualize your data in ways that really tell a story? If you’re asking yourself, “Is Excel a business intelligence tool? ” this article is for you. We’ll explore what Excel can really do for your data, where it shines, and where it falls short compared to specialized BI platforms.
By the end, you’ll know exactly when Excel is enough and when it’s time to look beyond. Ready to unlock the power of your data? Let’s dive in.
Credit: www.amazon.com
Excel’s Bi Features
Excel offers several business intelligence (BI) features that help users analyze and visualize data. These features support basic BI tasks. Users can import data, create summaries, and generate charts easily. Excel’s tools are suitable for small to medium datasets and simple reports.
Data Import And Integration
Excel allows importing data from many sources. Users can bring in files like CSV, TXT, and XML. It also connects to databases such as Access and SQL Server. This integration helps gather data in one place for analysis. Excel supports manual and automated data imports, saving time.
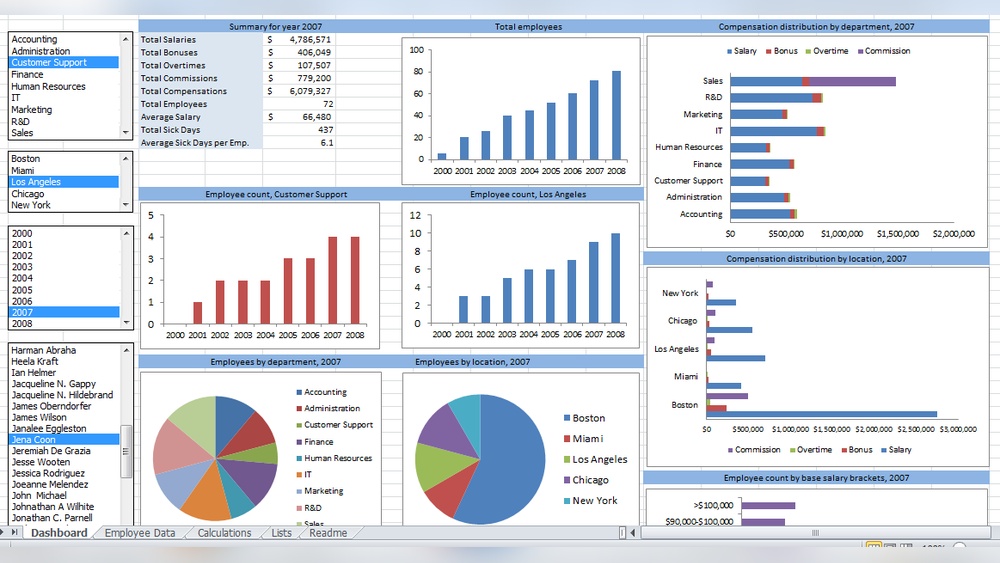
Pivottables And Charts
PivotTables help summarize large amounts of data quickly. Users can group, filter, and sort data with ease. Charts turn data into visual stories. Excel offers bar, line, pie charts, and more. These tools make data easier to understand and present.
Basic Data Analysis
Excel provides simple analysis tools like formulas and functions. Users can calculate sums, averages, and other statistics. Conditional formatting highlights key data points. Users can also use tools like Goal Seek and Solver for basic forecasting. These features aid in making informed decisions.

Credit: www.geeky-gadgets.com
Comparing Excel And Power Bi
Excel and Power BI both serve in business intelligence, but they differ greatly. Each tool fits different needs and data scenarios. Understanding their strengths helps choose the right one for your tasks. Below, we compare Excel and Power BI in key areas.
Handling Large Datasets
Excel works well with small to medium datasets. Performance drops as file size grows. It can slow down or crash with too much data.
Power BI handles very large datasets smoothly. It uses powerful compression and fast data engines. This makes it ideal for big data analysis and reporting.
Data Source Connectivity
Excel supports many data sources but often needs manual updates. It connects mainly to files, databases, and simple web data.
Power BI connects to a wider range of sources. It links directly to cloud services, databases, and live data streams. Updates can happen automatically and in real time.
Dashboard Interactivity
Excel dashboards are mostly static with limited interactive features. Users can filter or sort, but experience is basic.
Power BI offers rich interactivity. Users can click, drill down, and explore data dynamically. Dashboards update instantly based on user actions.
Excel’s Limitations For Bi
Excel is widely used for data analysis and simple business intelligence tasks. It offers many features that help users create reports and visualize data easily. Despite these strengths, Excel has important limits that affect its use in business intelligence. Understanding these limitations helps businesses decide if Excel meets their BI needs or if they require more specialized tools.
Scalability Challenges
Excel can slow down with large data sets. Handling millions of rows is difficult and often causes crashes. It lacks the power of dedicated BI tools designed for big data. Users face delays and errors when working with complex models. This makes Excel less reliable for growing business needs.
Limited Real-time Data Support
Excel does not support real-time data updates easily. It requires manual refreshing or importing data repeatedly. Live dashboards and instant data changes are hard to maintain. Businesses miss out on timely insights and fast decision-making. Dedicated BI tools provide better automation and live data connections.
Collaboration Issues
Sharing Excel files can cause version control problems. Multiple users working on the same file may overwrite data accidentally. It lacks built-in features for smooth, real-time teamwork. Tracking changes and managing permissions is complex. BI platforms offer stronger collaboration tools for teams.
When To Use Excel For Bi
Excel offers useful business intelligence features for many situations. Knowing when to use Excel for BI helps maximize efficiency and insight. Excel works well with smaller datasets and quick tasks. It allows simple data analysis without complex software. Understanding Excel’s strengths ensures the right tool fits each BI need.
Small To Medium Data Projects
Excel handles small to medium data projects effectively. It can import data from spreadsheets, CSV files, and databases. Users can clean, organize, and analyze data within Excel easily. For projects with limited data size, Excel offers quick processing. It avoids the need for expensive BI software in these cases.
Quick Reporting And Visualization
Creating reports fast is simple with Excel’s built-in tools. PivotTables allow summarizing data quickly without deep technical skills. Charts and graphs help visualize trends and comparisons clearly. Excel’s templates speed up report preparation. This makes it ideal for urgent business updates and one-time reports.
Initial Data Exploration
Excel is perfect for early stages of data exploration. Users can spot patterns and outliers by sorting and filtering data. Basic formulas help calculate key metrics instantly. This early insight guides further detailed analysis. Excel serves as a stepping stone before moving to advanced BI platforms.
Enhancing Excel’s Bi Capabilities
Excel offers solid features for business intelligence but has limits. Enhancing its BI capabilities helps users handle data more efficiently and gain better insights. Simple tools within Excel can be extended using add-ins, macros, and integration with other BI software. These improvements turn Excel into a more powerful aid for business decisions without switching platforms.
Using Add-ins And Connectors
Add-ins expand Excel’s functionality by adding new tools and features. Connectors allow Excel to pull data directly from databases, websites, or cloud services. This reduces manual data entry and errors. Popular add-ins like Power Query simplify data import and transformation. They help prepare data faster and keep it up to date. Using these tools, Excel becomes better at handling diverse data sources.
Automating Tasks With Macros
Macros automate repetitive tasks in Excel by recording sequences of actions. Users can run macros to update reports or clean data automatically. This saves time and ensures consistency in data processing. Creating simple macros requires no coding skills, making automation accessible. By reducing manual work, macros help users focus on analyzing results rather than preparing data.
Integrating With Other Bi Tools
Excel can connect with advanced BI platforms to enhance reporting and visualization. Exporting Excel data to tools like Power BI allows for interactive dashboards and deeper insights. Integration supports live data refresh and multi-source analysis. This combination leverages Excel’s familiarity with powerful BI features. Users gain the best of both worlds—ease of use and advanced analytics.

Credit: www.prime8consulting.com
Future Of Excel In Bi
Excel continues to evolve as a tool for business intelligence (BI). Its future in BI looks promising due to ongoing enhancements. These improvements aim to expand Excel’s capabilities beyond basic data tasks. Excel is becoming more integrated with modern BI needs.
Integration With Cloud Services
Excel now connects better with cloud platforms like Microsoft Azure and OneDrive. This integration allows users to access and update data from anywhere. Cloud support helps Excel handle larger datasets without slowing down. It also enables smoother data sharing across teams and devices. Cloud services make Excel more flexible for BI work.
Improved Collaboration Features
Excel’s collaboration tools are getting stronger. Multiple users can work on a spreadsheet at the same time. Changes appear in real time, reducing version control problems. Comments and notes help teams communicate directly within the file. These features make Excel more useful for group BI projects. Collaboration now feels more natural and efficient.
Evolving Analytics Functions
Excel is adding advanced analytics tools like dynamic arrays and enhanced data types. New formulas simplify complex calculations and data manipulation. Power Query and Power Pivot improve data modeling and transformation. These features allow deeper insights without leaving Excel. The analytics capabilities are growing to meet BI demands.
Frequently Asked Questions
Is Microsoft Excel A Business Intelligence Tool?
Microsoft Excel offers basic business intelligence features like data gathering, visualization, and simple analysis. It lacks advanced scalability and real-time capabilities compared to dedicated BI tools like Power BI. Excel suits small datasets but isn’t ideal for complex, large-scale business intelligence tasks.
Which Tool Is Widely Used For Business Intelligence?
Power BI is widely used for business intelligence due to its advanced data visualization, real-time updates, and scalability features.
What Type Of Tool Is Excel?
Excel is a spreadsheet tool used for data organization, basic analysis, and visualization. It supports simple business intelligence tasks but lacks advanced BI features like real-time data and large dataset handling.
Is Microsoft Excel An Ai Tool?
Microsoft Excel is not an AI tool but a spreadsheet software with some data analysis features. It lacks advanced AI capabilities.
Conclusion
Excel offers useful features for basic business intelligence tasks. It handles small datasets well and creates simple reports. Yet, it struggles with large data and complex analysis. Dedicated BI tools provide better data connections and real-time collaboration. Excel suits beginners or small projects but lacks automation and advanced visuals.
Choose the right tool based on your business needs. Excel can be a helpful starting point in your BI journey.